TAMPA, Fla. (WFLA) — There is arguably nothing more influential in determining how active the Atlantic hurricane season will be than El Niño and La Niña. La Niñas typically cause more active seasons than El Niño; but how much more active?
An exclusive Max Defender 8 analysis reveals the difference is even more shocking than previously thought, with La Niñas producing triple the number of hurricanes over the past 30 years.
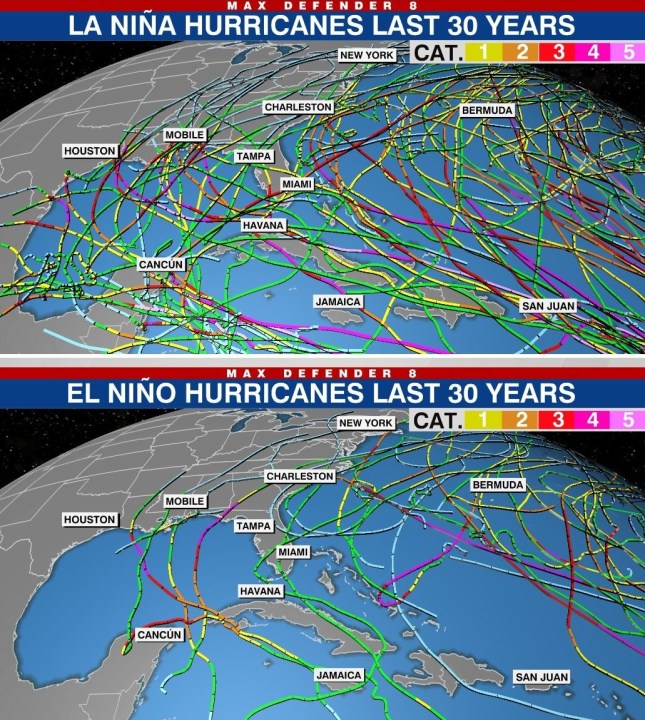
The image below shows a direct comparison between all hurricane tracks during nine La Niña seasons – the top image – and during nine El Niño seasons – the bottom image. The difference is stark.
Here’s a slider comparison to help further illustrate the difference:
Since La Niña is ongoing right now and is expected to continue into the peak of season, it should be no surprise if this season is active. All the main seasonal forecast outfits, including NOAA and Colorado State University, are calling for an active season ahead.

If these forecasts bear out, this would be the seventh season in a row with an above-average hurricane season. Of course this says nothing about the tracks of storms or where they may make landfall. Predicting that months in advance is not possible.
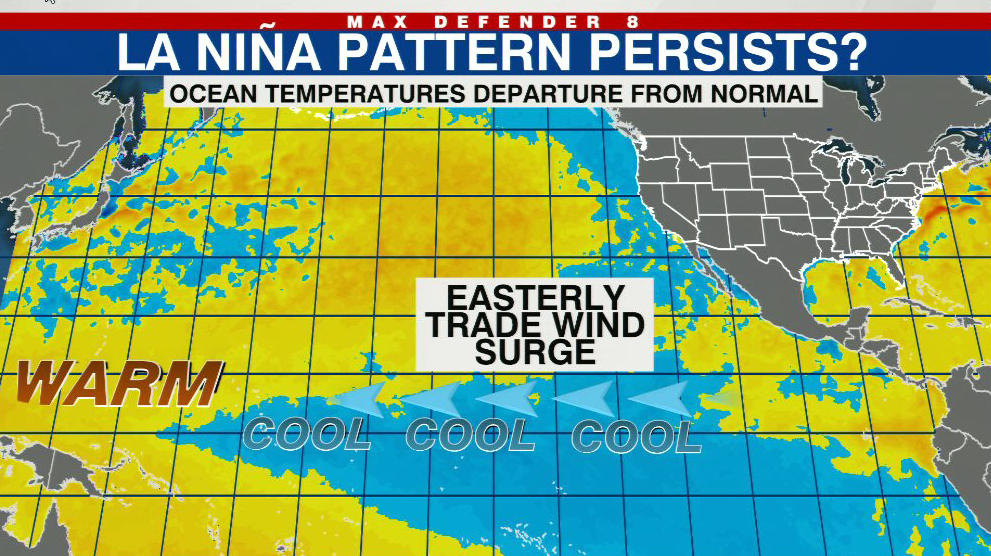
La Niña is a cooling of the Equatorial Pacific waters and El Niño is a warming. Typically the Pacific jockeys back and forth every couple of years between these two phases, with some years being neutral. This oscillation is part of the natural variability baked into the climate system.
This summer is the third La Niña in a row, called a triple drip La Niña. It’s rare but not unheard of.
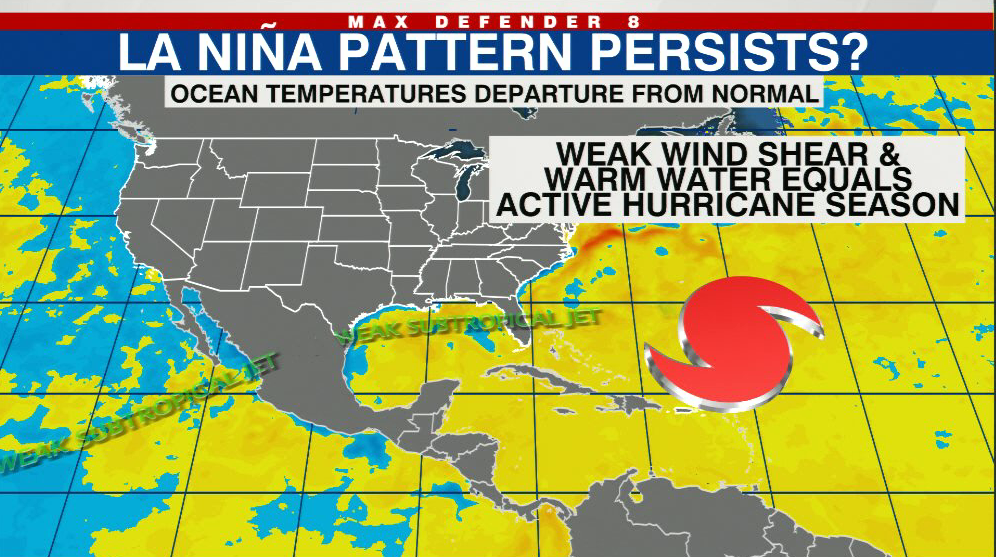
During La Niñas, the cooler water in the Tropical Pacific Ocean results in a weaker and further north jet stream flowing out of the Pacific Ocean into the Atlantic Ocean. As a consequence, the upper level winds over the Atlantic are weaker and tropical systems have a better chance of growing without being disturbed by wind shear.
The analysis was done by Max Defender 8 Meteorologist Eric Stone and Chief Meteorologist and Climate Specialist Jeff Berardelli. For those meteorologically inclined, the criteria used for the analysis is below:
The phase of the oscillation, El Niño or La Niña, in any given hurricane season, was determined by how far above or below normal the temperature of the Equatorial Pacific sea surface was. As is typical, the threshold for El Niños is defined as .5 degrees C above normal and the threshold for La Niña is .5 degrees C below normal (in the Niño 3.4 region.) This was determined using three-month average values for August, September and October, which coincides with the peak of hurricane season, from NOAA’s Climate Prediction Center.
The analysis found an equal number since 1991: nine El Niños and nine La Niñas. The year 2021 is not included because, as of the date of this analysis, the National Hurricane Center has not yet published the final season review for 2021. But 2021 was a La Niña year and thus would act to heighten the difference.
El Niño years are as follows: 1991, 1994, 1997, 2002, 2004, 2006, 2009, 2015 and 2018 for a total of 33 hurricanes.
La Niña years are as follows: 1995, 1998, 1999, 2000, 2007, 2010, 2011, 2016 and 2020 for a total of 96 hurricanes.