The vaccine deployment in December 2020 signaled a turning point in the COVID-19 pandemic. By the end of May 2021, 40% of the U.S. population was fully vaccinated. But as vaccination rates lagged over the summer, new surges of COVID-19 came, including Delta in the summer of 2021, and now the Omicron variant, which comprises the majority of cases in the U.S.
The United States as of Jun. 24 reached over 1 million COVID-19-related deaths and nearly 86.8 million COVID-19 cases, according to Johns Hopkins University. Currently, 66.9% of the population is fully vaccinated, and 47.3% of vaccinated people have received booster doses.
Stacker compiled a list of the counties with highest COVID-19 vaccination rates in Florida using data from the U.S. Department of Health & Human Services and Covid Act Now. Counties are ranked by the highest vaccination rate as of Jun. 23, 2022. Due to inconsistencies in reporting, some counties do not have vaccination data available. Keep reading to see whether your county ranks among the highest COVID-19 vaccination rates in your state.

1 / 50Michael Rivera // Wikimedia Commons
#50. Bradford County
– Population that is fully vaccinated: 44.9% (12,654 fully vaccinated)
— 33.6% lower vaccination rate than Florida
– Cumulative deaths per 100k: 532 (150 total deaths)
— 51.6% more deaths per 100k residents than Florida
– Cumulative cases per 100k: 27,432 (7,736 total cases)
— 8.1% less cases per 100k residents than Florida

2 / 50Ebyabe // Wikimedia Commons
#49. Wakulla County
– Population that is fully vaccinated: 45.3% (15,267 fully vaccinated)
— 33.0% lower vaccination rate than Florida
– Cumulative deaths per 100k: 379 (128 total deaths)
— 8.0% more deaths per 100k residents than Florida
– Cumulative cases per 100k: 30,564 (10,312 total cases)
— 2.4% more cases per 100k residents than Florida

3 / 50Ebyabe // Wikimedia Commons
#48. Madison County
– Population that is fully vaccinated: 46.5% (8,595 fully vaccinated)
— 31.2% lower vaccination rate than Florida
– Cumulative deaths per 100k: 530 (98 total deaths)
— 51.0% more deaths per 100k residents than Florida
– Cumulative cases per 100k: 32,650 (6,038 total cases)
— 9.4% more cases per 100k residents than Florida
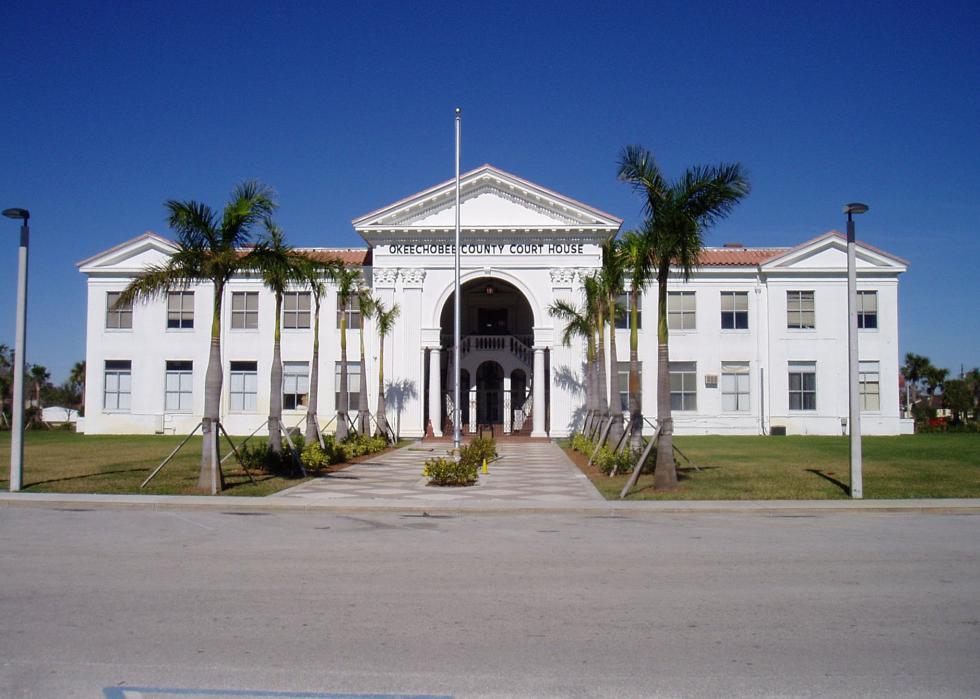
4 / 50Bastique // Wikimedia Commons
#47. Okeechobee County
– Population that is fully vaccinated: 46.8% (19,745 fully vaccinated)
— 30.8% lower vaccination rate than Florida
– Cumulative deaths per 100k: 436 (184 total deaths)
— 24.2% more deaths per 100k residents than Florida
– Cumulative cases per 100k: 25,982 (10,956 total cases)
— 12.9% less cases per 100k residents than Florida

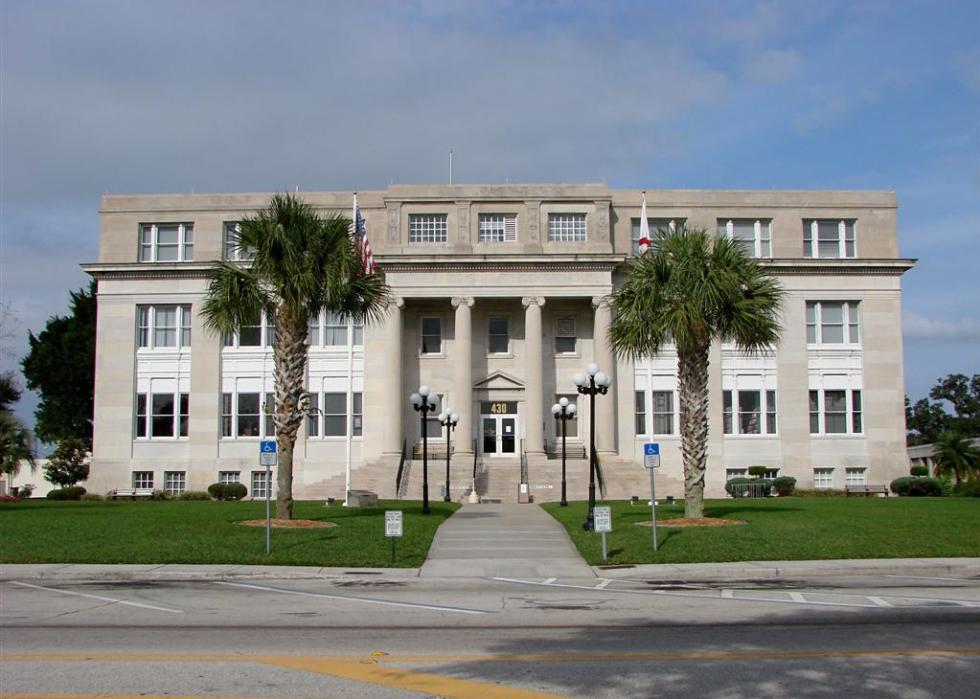
5 / 50Ebyabe // Wikimedia Commons
#46. DeSoto County
– Population that is fully vaccinated: 47.0% (17,845 fully vaccinated)
— 30.5% lower vaccination rate than Florida
– Cumulative deaths per 100k: 397 (151 total deaths)
— 13.1% more deaths per 100k residents than Florida
– Cumulative cases per 100k: 25,807 (9,807 total cases)
— 13.5% less cases per 100k residents than Florida

6 / 50Ebyabe // Wikimedia Commons
#45. Levy County
– Population that is fully vaccinated: 47.6% (19,761 fully vaccinated)
— 29.6% lower vaccination rate than Florida
– Cumulative deaths per 100k: 402 (167 total deaths)
— 14.5% more deaths per 100k residents than Florida
– Cumulative cases per 100k: 25,598 (10,624 total cases)
— 14.2% less cases per 100k residents than Florida

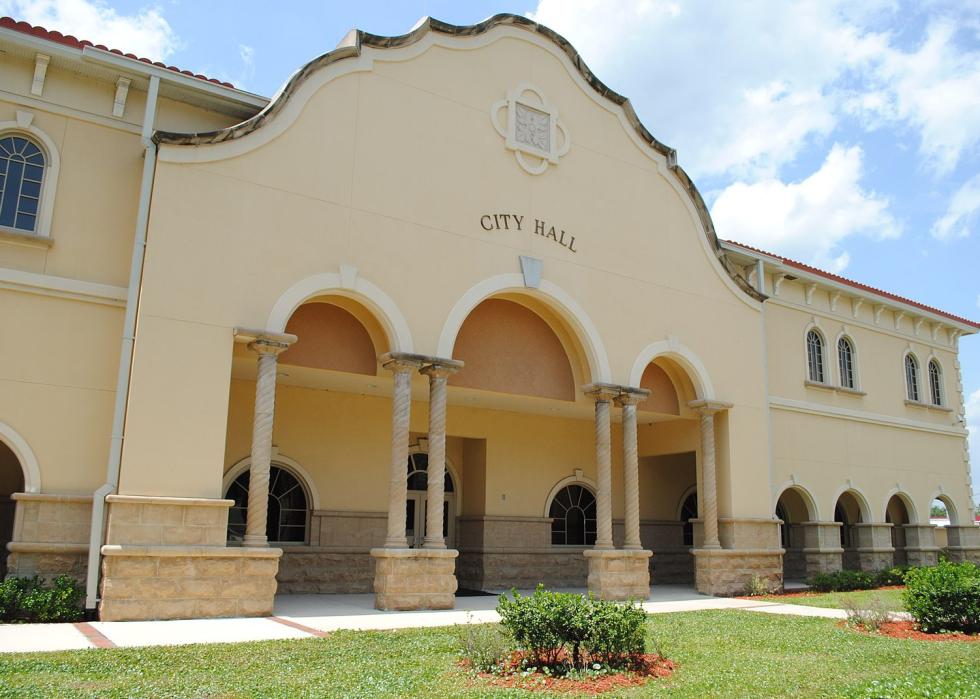
7 / 50Ebyabe // Wikimedia Commons
#44. Franklin County
– Population that is fully vaccinated: 48.5% (5,886 fully vaccinated)
— 28.3% lower vaccination rate than Florida
– Cumulative deaths per 100k: 437 (53 total deaths)
— 24.5% more deaths per 100k residents than Florida
– Cumulative cases per 100k: 26,392 (3,200 total cases)
— 11.5% less cases per 100k residents than Florida

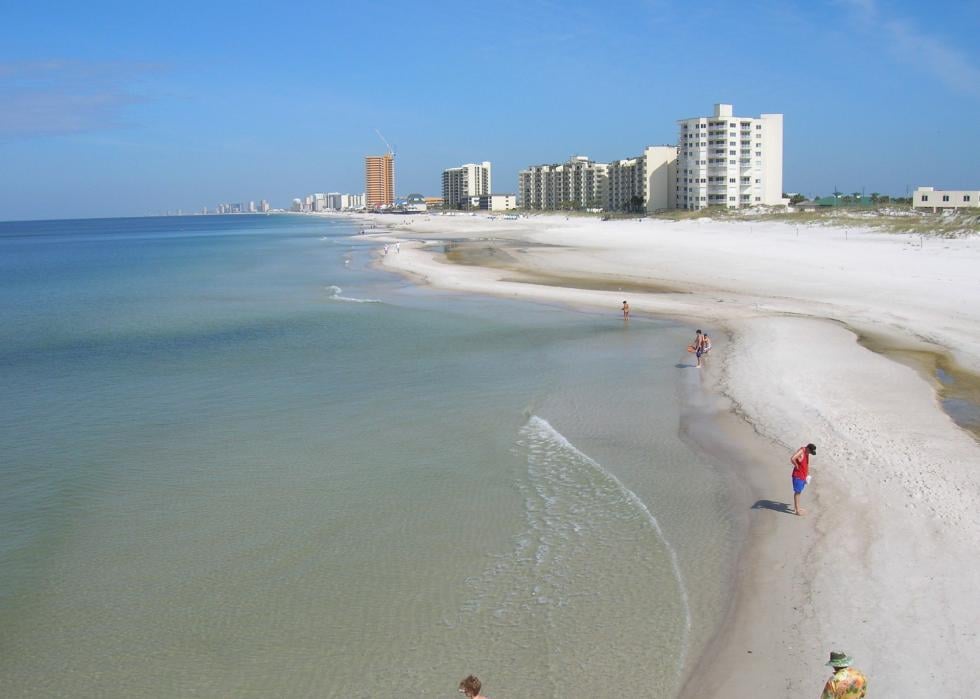
8 / 50Ebyabe // Wikimedia Commons
#43. Walton County
– Population that is fully vaccinated: 49.7% (36,826 fully vaccinated)
— 26.5% lower vaccination rate than Florida
– Cumulative deaths per 100k: 289 (214 total deaths)
— 17.7% less deaths per 100k residents than Florida
– Cumulative cases per 100k: 24,296 (17,996 total cases)
— 18.6% less cases per 100k residents than Florida

9 / 50Ebyabe // Wikimedia Commons
#42. Hendry County
– Population that is fully vaccinated: 50.4% (21,177 fully vaccinated)
— 25.4% lower vaccination rate than Florida
– Cumulative deaths per 100k: 383 (161 total deaths)
— 9.1% more deaths per 100k residents than Florida
– Cumulative cases per 100k: 28,859 (12,127 total cases)
— 3.3% less cases per 100k residents than Florida

10 / 50Ebyabe // Wikimedia Commons
#41. Gulf County
– Population that is fully vaccinated: 52.5% (7,165 fully vaccinated)
— 22.3% lower vaccination rate than Florida
– Cumulative deaths per 100k: 587 (80 total deaths)
— 67.2% more deaths per 100k residents than Florida
– Cumulative cases per 100k: 32,546 (4,439 total cases)
— 9.1% more cases per 100k residents than Florida
11 / 50Fl295 // Wikimedia Commons
#40. Highlands County
– Population that is fully vaccinated: 52.9% (56,243 fully vaccinated)
— 21.7% lower vaccination rate than Florida
– Cumulative deaths per 100k: 653 (694 total deaths)
— 86.0% more deaths per 100k residents than Florida
– Cumulative cases per 100k: 23,935 (25,424 total cases)
— 19.8% less cases per 100k residents than Florida
12 / 50j.s. clark // Wikimedia Commons
#39. Bay County
– Population that is fully vaccinated: 53.8% (93,915 fully vaccinated)
— 20.4% lower vaccination rate than Florida
– Cumulative deaths per 100k: 476 (832 total deaths)
— 35.6% more deaths per 100k residents than Florida
– Cumulative cases per 100k: 27,655 (48,314 total cases)
— 7.3% less cases per 100k residents than Florida
13 / 50Excel23 // Wikimedia Commons
#38. Clay County
– Population that is fully vaccinated: 54.7% (119,958 fully vaccinated)
— 19.1% lower vaccination rate than Florida
– Cumulative deaths per 100k: 394 (864 total deaths)
— 12.3% more deaths per 100k residents than Florida
– Cumulative cases per 100k: 25,700 (56,348 total cases)
— 13.9% less cases per 100k residents than Florida
14 / 50Canva
#37. Santa Rosa County
– Population that is fully vaccinated: 54.8% (100,933 fully vaccinated)
— 18.9% lower vaccination rate than Florida
– Cumulative deaths per 100k: 339 (625 total deaths)
— 3.4% less deaths per 100k residents than Florida
– Cumulative cases per 100k: 27,462 (50,616 total cases)
— 8.0% less cases per 100k residents than Florida

15 / 50Daniel Wilton // Wikimedia Commons
#36. Hernando County
– Population that is fully vaccinated: 55.4% (107,436 fully vaccinated)
— 18.0% lower vaccination rate than Florida
– Cumulative deaths per 100k: 573 (1,111 total deaths)
— 63.2% more deaths per 100k residents than Florida
– Cumulative cases per 100k: 23,181 (44,952 total cases)
— 22.3% less cases per 100k residents than Florida

16 / 50Canva
#35. Escambia County
– Population that is fully vaccinated: 56.5% (180,002 fully vaccinated)
— 16.4% lower vaccination rate than Florida
– Cumulative deaths per 100k: 416 (1,323 total deaths)
— 18.5% more deaths per 100k residents than Florida
– Cumulative cases per 100k: 26,585 (84,624 total cases)
— 10.9% less cases per 100k residents than Florida

17 / 50Ebyabe // Wikimedia Commons
#34. Citrus County
– Population that is fully vaccinated: 56.9% (85,095 fully vaccinated)
— 15.8% lower vaccination rate than Florida
– Cumulative deaths per 100k: 660 (988 total deaths)
— 88.0% more deaths per 100k residents than Florida
– Cumulative cases per 100k: 21,275 (31,839 total cases)
— 28.7% less cases per 100k residents than Florida

18 / 50Canva
#33. Leon County
– Population that is fully vaccinated: 57.3% (168,164 fully vaccinated)
— 15.2% lower vaccination rate than Florida
– Cumulative deaths per 100k: 230 (675 total deaths)
— 34.5% less deaths per 100k residents than Florida
– Cumulative cases per 100k: 31,218 (91,649 total cases)
— 4.6% more cases per 100k residents than Florida
19 / 50Canva
#32. Marion County
– Population that is fully vaccinated: 57.4% (209,844 fully vaccinated)
— 15.1% lower vaccination rate than Florida
– Cumulative deaths per 100k: 585 (2,139 total deaths)
— 66.7% more deaths per 100k residents than Florida
– Cumulative cases per 100k: 23,996 (87,724 total cases)
— 19.6% less cases per 100k residents than Florida

20 / 50Canva
#31. Polk County
– Population that is fully vaccinated: 57.9% (419,798 fully vaccinated)
— 14.3% lower vaccination rate than Florida
– Cumulative deaths per 100k: 417 (3,024 total deaths)
— 18.8% more deaths per 100k residents than Florida
– Cumulative cases per 100k: 29,655 (214,932 total cases)
— 0.6% less cases per 100k residents than Florida
21 / 50Canva
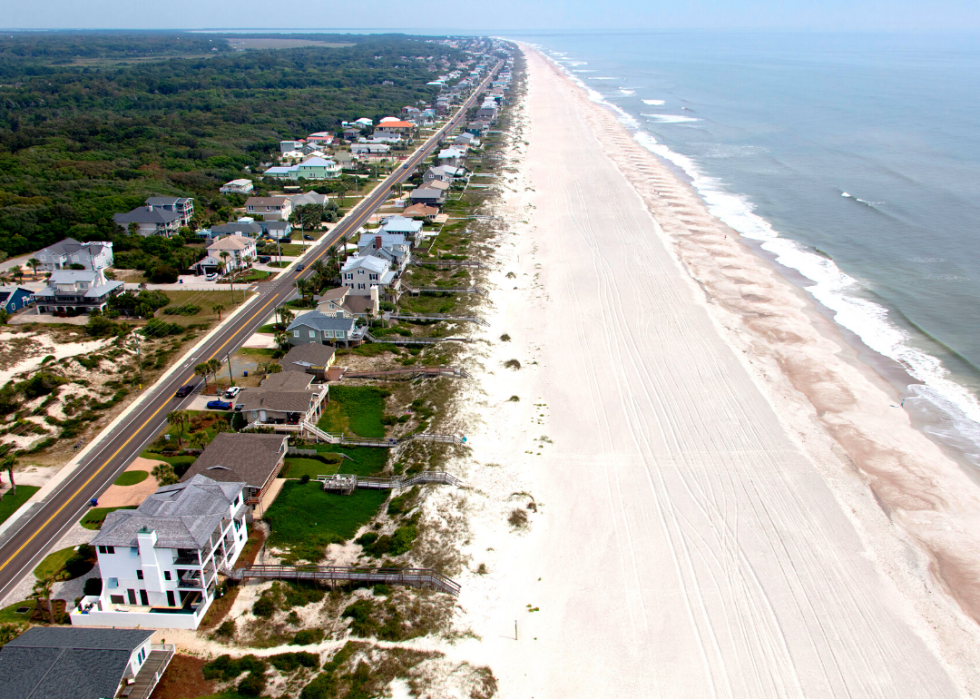
#30. Nassau County
– Population that is fully vaccinated: 58.3% (51,696 fully vaccinated)
— 13.8% lower vaccination rate than Florida
– Cumulative deaths per 100k: 336 (298 total deaths)
— 4.3% less deaths per 100k residents than Florida
– Cumulative cases per 100k: 26,578 (23,555 total cases)
— 10.9% less cases per 100k residents than Florida

22 / 50Michael Rivera // Wikimedia Commons
#29. Gadsden County
– Population that is fully vaccinated: 58.5% (26,716 fully vaccinated)
— 13.5% lower vaccination rate than Florida
– Cumulative deaths per 100k: 456 (208 total deaths)
— 29.9% more deaths per 100k residents than Florida
– Cumulative cases per 100k: 30,869 (14,095 total cases)
— 3.5% more cases per 100k residents than Florida

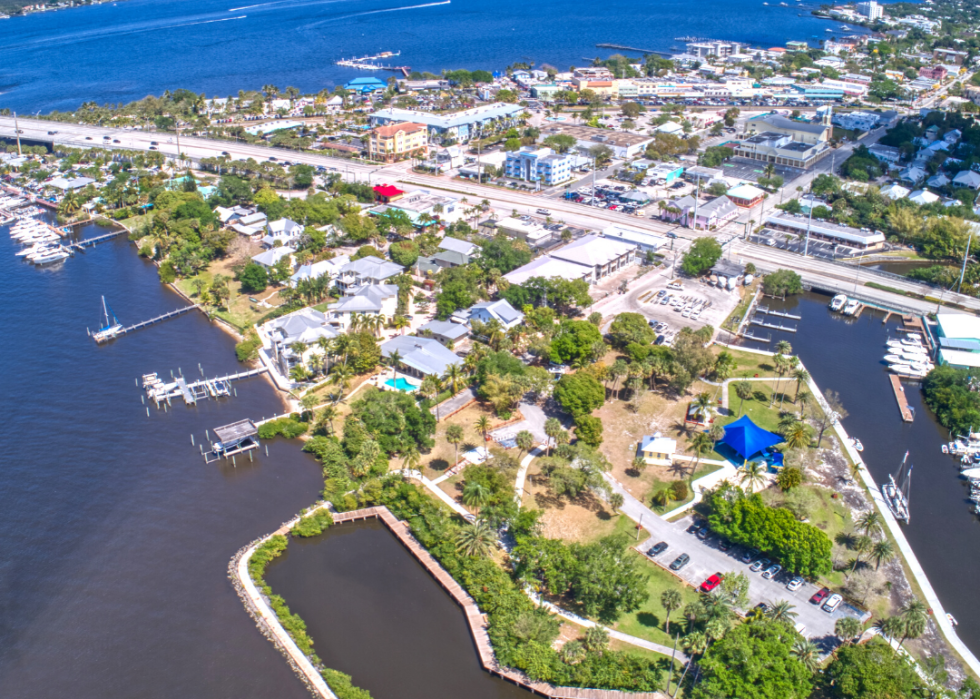
23 / 50Georgia Guercio // Wikimedia Commons
#28. St. Lucie County
– Population that is fully vaccinated: 59.1% (194,150 fully vaccinated)
— 12.6% lower vaccination rate than Florida
– Cumulative deaths per 100k: 379 (1,243 total deaths)
— 8.0% more deaths per 100k residents than Florida
– Cumulative cases per 100k: 24,287 (79,732 total cases)
— 18.6% less cases per 100k residents than Florida

24 / 50Ebyabe // Wikimedia Commons
#27. Pasco County
– Population that is fully vaccinated: 59.6% (329,876 fully vaccinated)
— 11.8% lower vaccination rate than Florida
– Cumulative deaths per 100k: 351 (1,943 total deaths)
— 0.0% less deaths per 100k residents than Florida
– Cumulative cases per 100k: 23,910 (132,446 total cases)
— 19.9% less cases per 100k residents than Florida

25 / 50User:Tim Ross // Wikimedia Commons
#26. Jefferson County
– Population that is fully vaccinated: 60.0% (8,551 fully vaccinated)
— 11.2% lower vaccination rate than Florida
– Cumulative deaths per 100k: 428 (61 total deaths)
— 21.9% more deaths per 100k residents than Florida
– Cumulative cases per 100k: 28,857 (4,111 total cases)
— 3.3% less cases per 100k residents than Florida

26 / 50Ebyabe // Wikimedia Commons
#25. Volusia County
– Population that is fully vaccinated: 60.2% (333,162 fully vaccinated)
— 10.9% lower vaccination rate than Florida
– Cumulative deaths per 100k: 365 (2,019 total deaths)
— 4.0% more deaths per 100k residents than Florida
– Cumulative cases per 100k: 22,906 (126,734 total cases)
— 23.2% less cases per 100k residents than Florida

27 / 50Canva
#24. Duval County
– Population that is fully vaccinated: 61.7% (590,671 fully vaccinated)
— 8.7% lower vaccination rate than Florida
– Cumulative deaths per 100k: 360 (3,447 total deaths)
— 2.6% more deaths per 100k residents than Florida
– Cumulative cases per 100k: 28,157 (269,672 total cases)
— 5.6% less cases per 100k residents than Florida

28 / 50Roman Eugeniusz // Wikimedia Commons
#23. Manatee County
– Population that is fully vaccinated: 62.4% (251,812 fully vaccinated)
— 7.7% lower vaccination rate than Florida
– Cumulative deaths per 100k: 363 (1,462 total deaths)
— 3.4% more deaths per 100k residents than Florida
– Cumulative cases per 100k: 25,762 (103,886 total cases)
— 13.6% less cases per 100k residents than Florida

29 / 50Xavier6984 // Wikimedia Commons
#22. Seminole County
– Population that is fully vaccinated: 62.6% (295,457 fully vaccinated)
— 7.4% lower vaccination rate than Florida
– Cumulative deaths per 100k: 235 (1,109 total deaths)
— 33.0% less deaths per 100k residents than Florida
– Cumulative cases per 100k: 23,860 (112,580 total cases)
— 20.0% less cases per 100k residents than Florida
30 / 50Nadezda Murmakova // Shutterstock
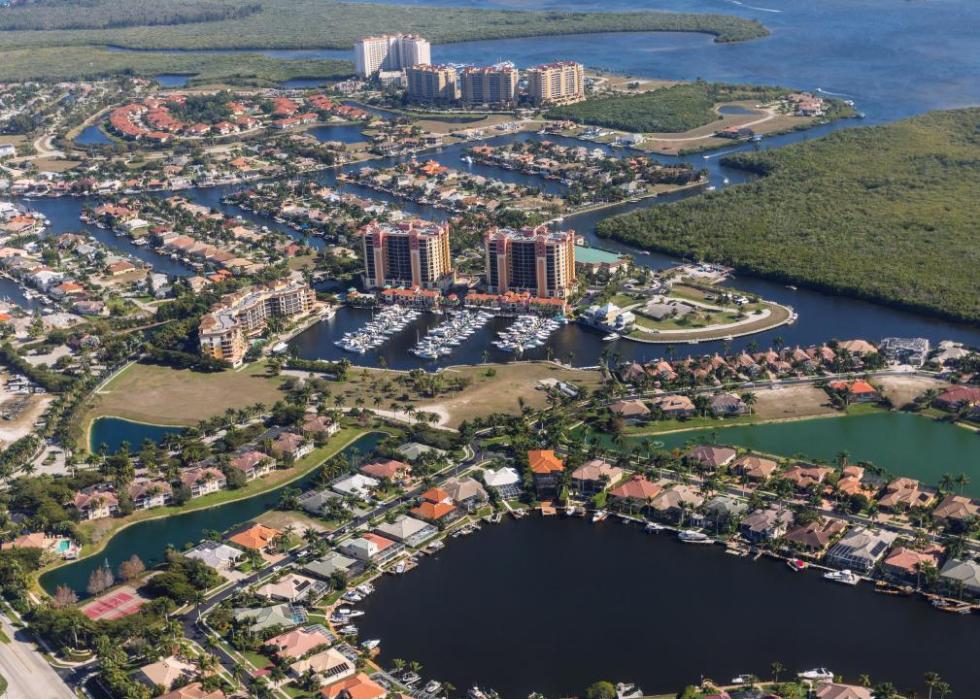
#21. Lee County
– Population that is fully vaccinated: 62.7% (483,114 fully vaccinated)
— 7.2% lower vaccination rate than Florida
– Cumulative deaths per 100k: 284 (2,192 total deaths)
— 19.1% less deaths per 100k residents than Florida
– Cumulative cases per 100k: 26,609 (205,043 total cases)
— 10.8% less cases per 100k residents than Florida

31 / 50Clément Bardot // Wikimedia Commons
#20. Hillsborough County
– Population that is fully vaccinated: 63.5% (934,585 fully vaccinated)
— 6.1% lower vaccination rate than Florida
– Cumulative deaths per 100k: 261 (3,848 total deaths)
— 25.6% less deaths per 100k residents than Florida
– Cumulative cases per 100k: 27,493 (404,695 total cases)
— 7.8% less cases per 100k residents than Florida

32 / 50Georgia Guercio // Wikimedia Commons
#19. Flagler County
– Population that is fully vaccinated: 64.2% (73,856 fully vaccinated)
— 5.0% lower vaccination rate than Florida
– Cumulative deaths per 100k: 315 (363 total deaths)
— 10.3% less deaths per 100k residents than Florida
– Cumulative cases per 100k: 21,050 (24,225 total cases)
— 29.4% less cases per 100k residents than Florida
33 / 50Canva
#18. Martin County
– Population that is fully vaccinated: 64.3% (103,451 fully vaccinated)
— 4.9% lower vaccination rate than Florida
– Cumulative deaths per 100k: 390 (628 total deaths)
— 11.1% more deaths per 100k residents than Florida
– Cumulative cases per 100k: 20,622 (33,202 total cases)
— 30.9% less cases per 100k residents than Florida

34 / 50Ebyabe // Wikimedia Commons
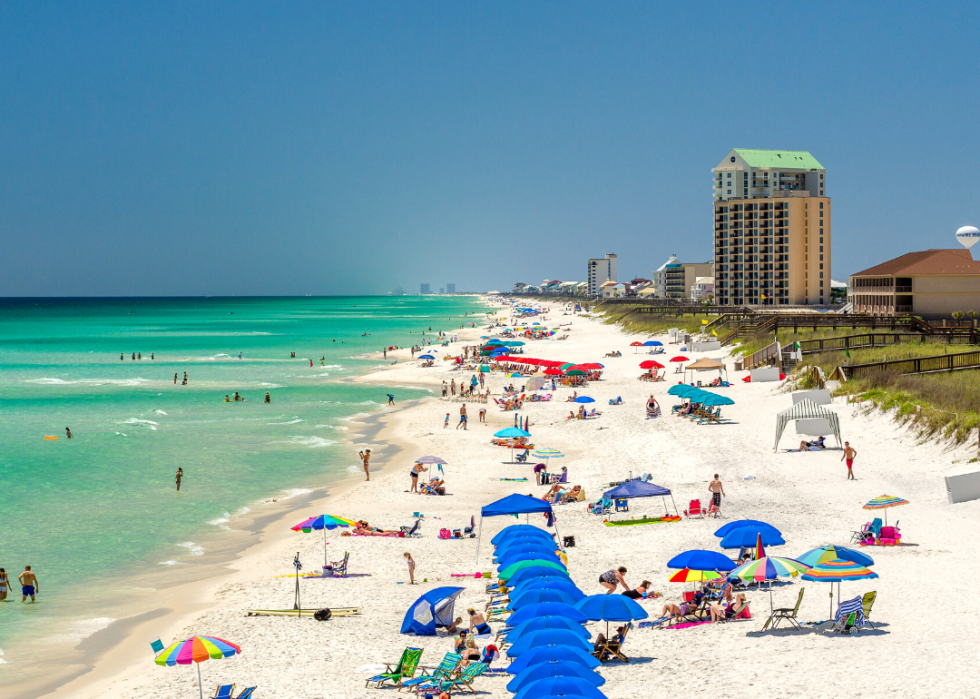
#17. Okaloosa County
– Population that is fully vaccinated: 64.8% (136,514 fully vaccinated)
— 4.1% lower vaccination rate than Florida
– Cumulative deaths per 100k: 329 (694 total deaths)
— 6.3% less deaths per 100k residents than Florida
– Cumulative cases per 100k: 25,573 (53,891 total cases)
— 14.3% less cases per 100k residents than Florida
35 / 50Canva
#16. Pinellas County
– Population that is fully vaccinated: 65.2% (635,975 fully vaccinated)
— 3.6% lower vaccination rate than Florida
– Cumulative deaths per 100k: 350 (3,415 total deaths)
— 0.3% less deaths per 100k residents than Florida
– Cumulative cases per 100k: 23,646 (230,551 total cases)
— 20.7% less cases per 100k residents than Florida
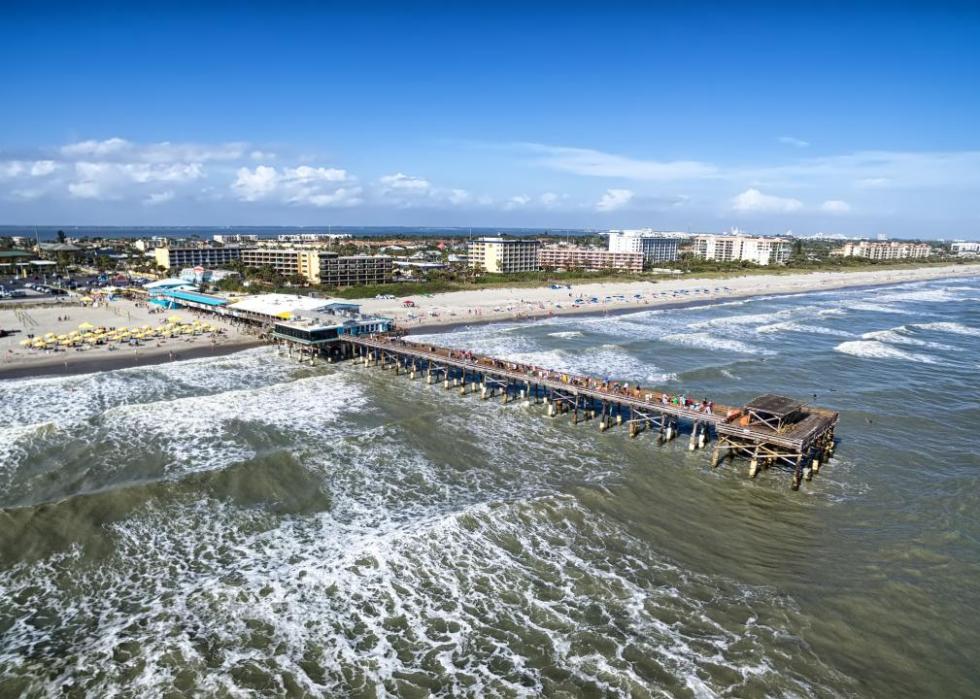
36 / 50Zhukova Valentyna // Shutterstock
#15. Brevard County
– Population that is fully vaccinated: 65.4% (393,716 fully vaccinated)
— 3.3% lower vaccination rate than Florida
– Cumulative deaths per 100k: 358 (2,156 total deaths)
— 2.0% more deaths per 100k residents than Florida
– Cumulative cases per 100k: 24,360 (146,634 total cases)
— 18.3% less cases per 100k residents than Florida
37 / 50Canva
#14. Charlotte County
– Population that is fully vaccinated: 66.1% (124,909 fully vaccinated)
— 2.2% lower vaccination rate than Florida
– Cumulative deaths per 100k: 437 (825 total deaths)
— 24.5% more deaths per 100k residents than Florida
– Cumulative cases per 100k: 20,753 (39,204 total cases)
— 30.4% less cases per 100k residents than Florida

38 / 50Canva
#13. Lake County
– Population that is fully vaccinated: 66.5% (244,265 fully vaccinated)
— 1.6% lower vaccination rate than Florida
– Cumulative deaths per 100k: 415 (1,525 total deaths)
— 18.2% more deaths per 100k residents than Florida
– Cumulative cases per 100k: 25,089 (92,107 total cases)
— 15.9% less cases per 100k residents than Florida

39 / 50DouglasGreen // Wikimedia Commons
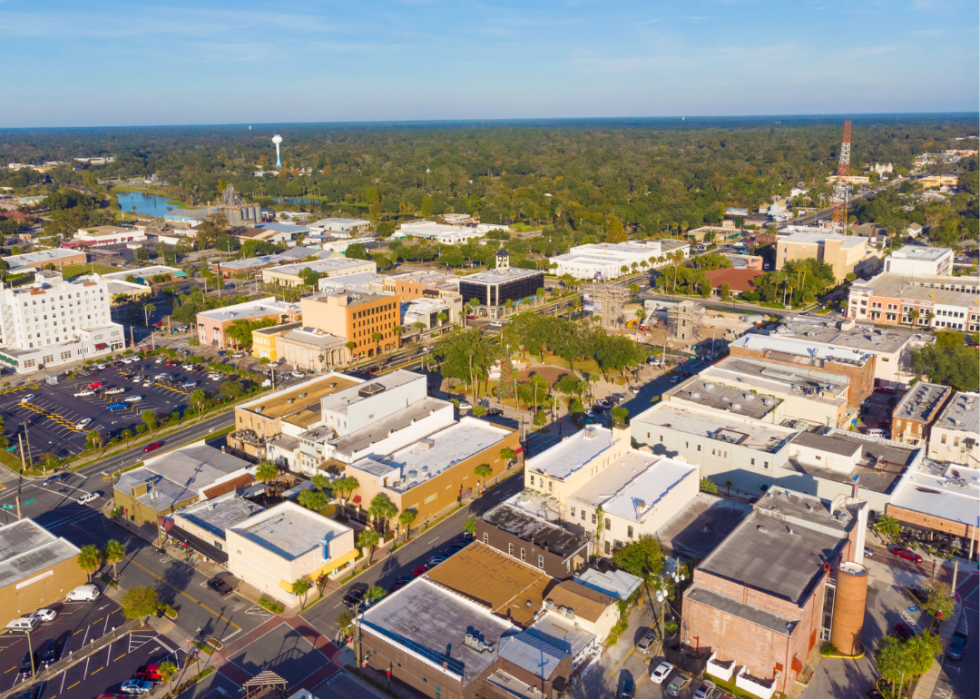
#12. Alachua County
– Population that is fully vaccinated: 66.9% (179,993 fully vaccinated)
— 1.0% lower vaccination rate than Florida
– Cumulative deaths per 100k: 253 (681 total deaths)
— 27.9% less deaths per 100k residents than Florida
– Cumulative cases per 100k: 27,382 (73,669 total cases)
— 8.2% less cases per 100k residents than Florida
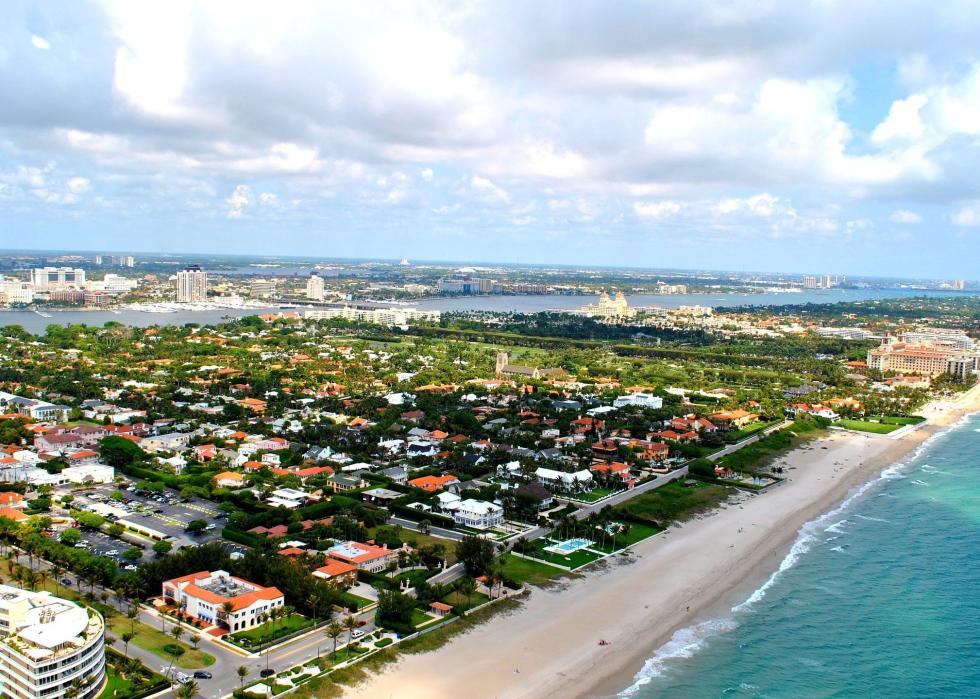
40 / 50Michael Kagdis // Wikimedia Commons
#11. Palm Beach County
– Population that is fully vaccinated: 67.0% (1,002,340 fully vaccinated)
— 0.9% lower vaccination rate than Florida
– Cumulative deaths per 100k: 343 (5,131 total deaths)
— 2.3% less deaths per 100k residents than Florida
– Cumulative cases per 100k: 27,066 (405,115 total cases)
— 9.3% less cases per 100k residents than Florida
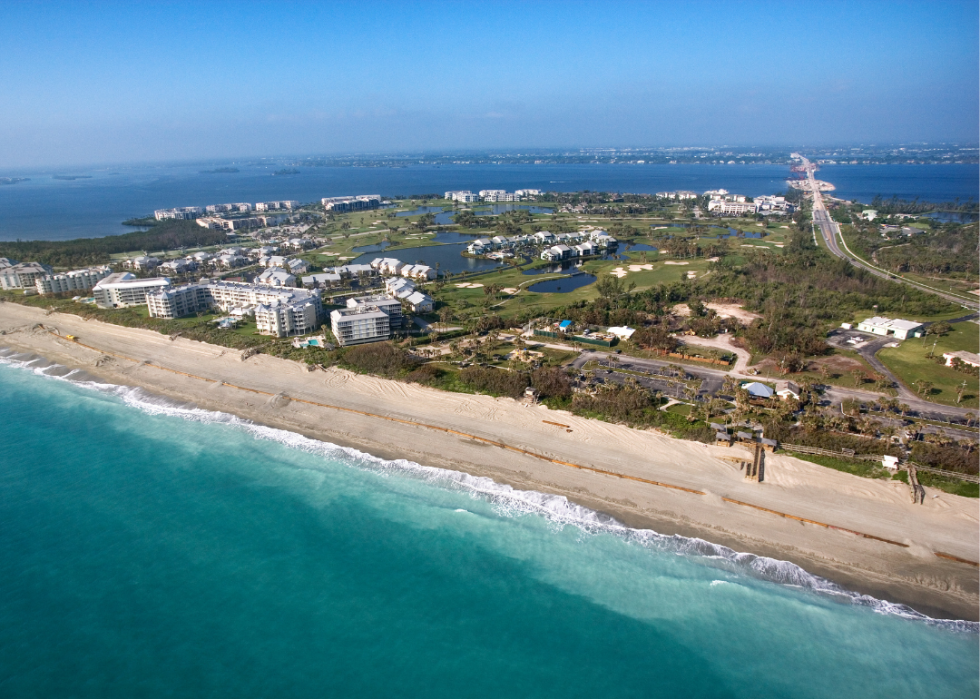
41 / 50Canva
#10. Indian River County
– Population that is fully vaccinated: 68.0% (108,744 fully vaccinated)
— 0.6% higher vaccination rate than Florida
– Cumulative deaths per 100k: 416 (666 total deaths)
— 18.5% more deaths per 100k residents than Florida
– Cumulative cases per 100k: 22,245 (35,575 total cases)
— 25.4% less cases per 100k residents than Florida

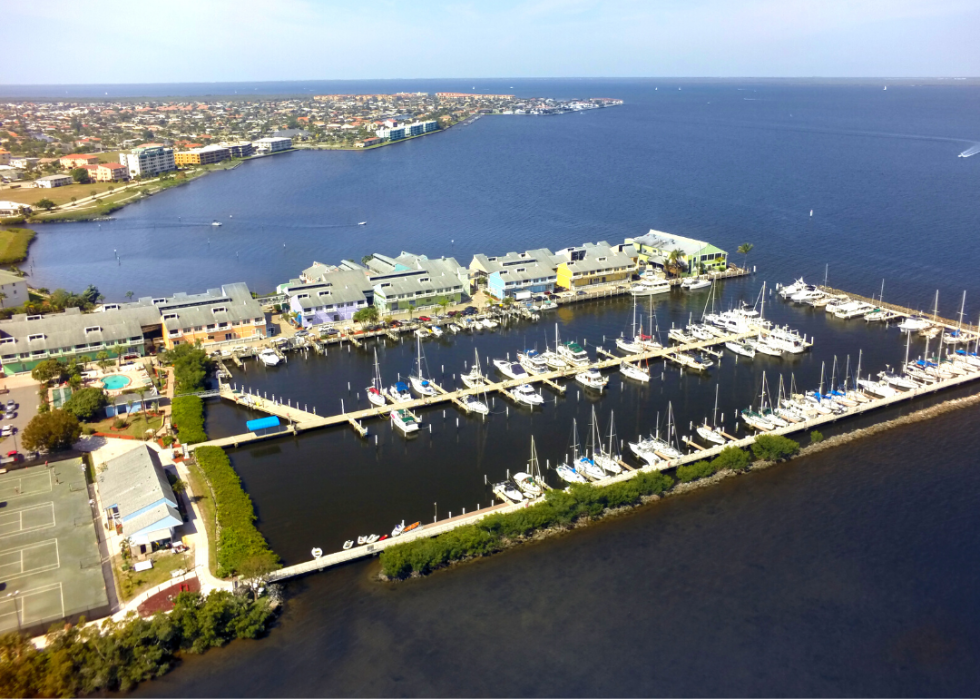
42 / 50Songquan Deng // Shutterstock
#9. Orange County
– Population that is fully vaccinated: 70.1% (976,129 fully vaccinated)
— 3.7% higher vaccination rate than Florida
– Cumulative deaths per 100k: 206 (2,872 total deaths)
— 41.3% less deaths per 100k residents than Florida
– Cumulative cases per 100k: 29,507 (411,159 total cases)
— 1.1% less cases per 100k residents than Florida
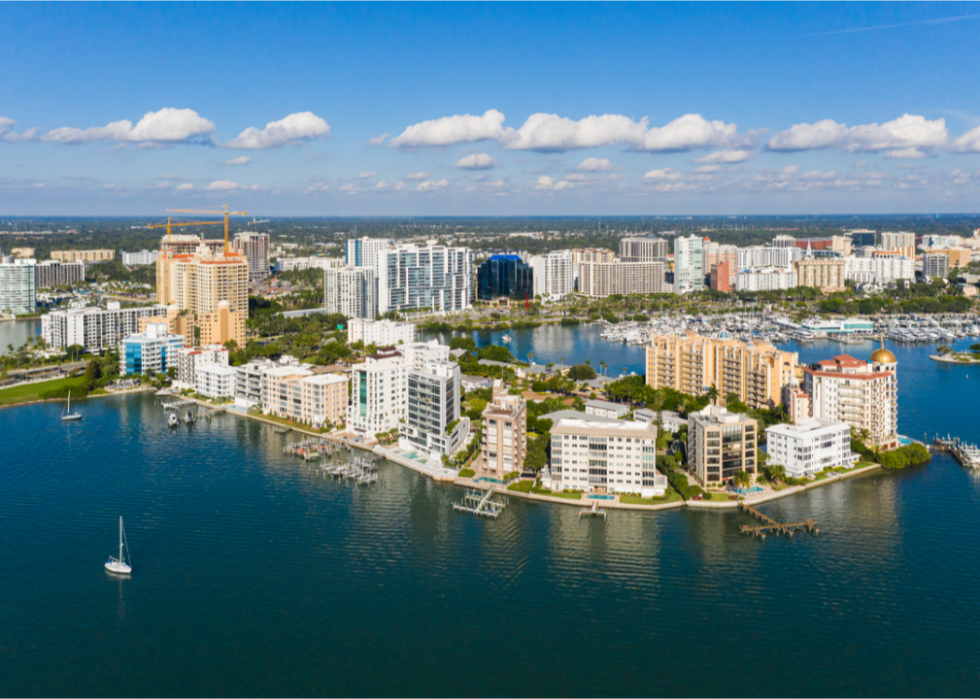
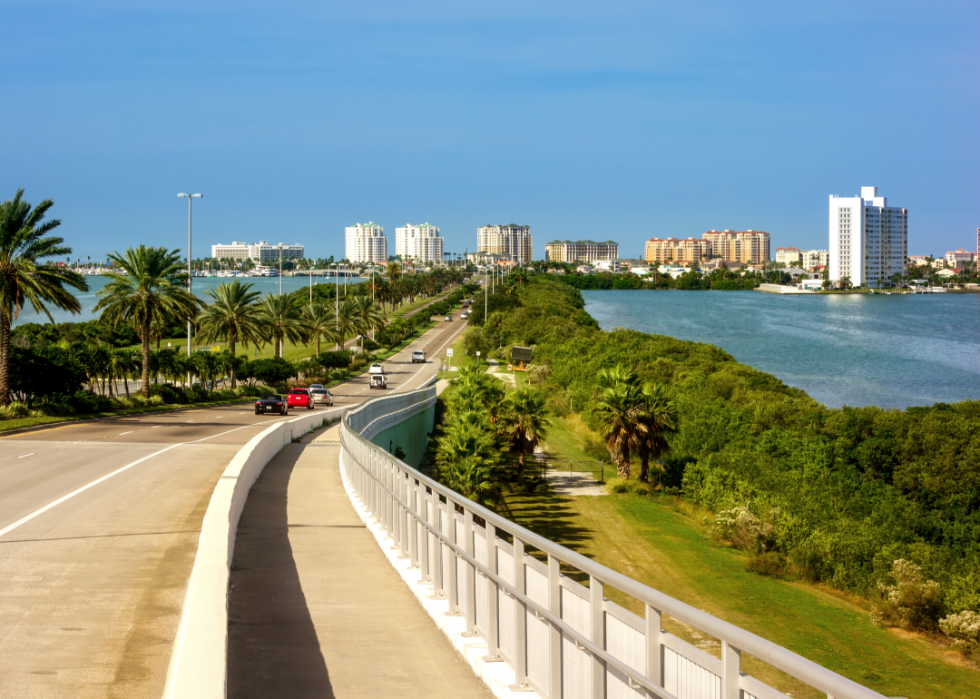
43 / 50Creative Couple Media // Shutterstock
#8. Sarasota County
– Population that is fully vaccinated: 70.6% (306,438 fully vaccinated)
— 4.4% higher vaccination rate than Florida
– Cumulative deaths per 100k: 382 (1,658 total deaths)
— 8.8% more deaths per 100k residents than Florida
– Cumulative cases per 100k: 23,176 (100,523 total cases)
— 22.3% less cases per 100k residents than Florida
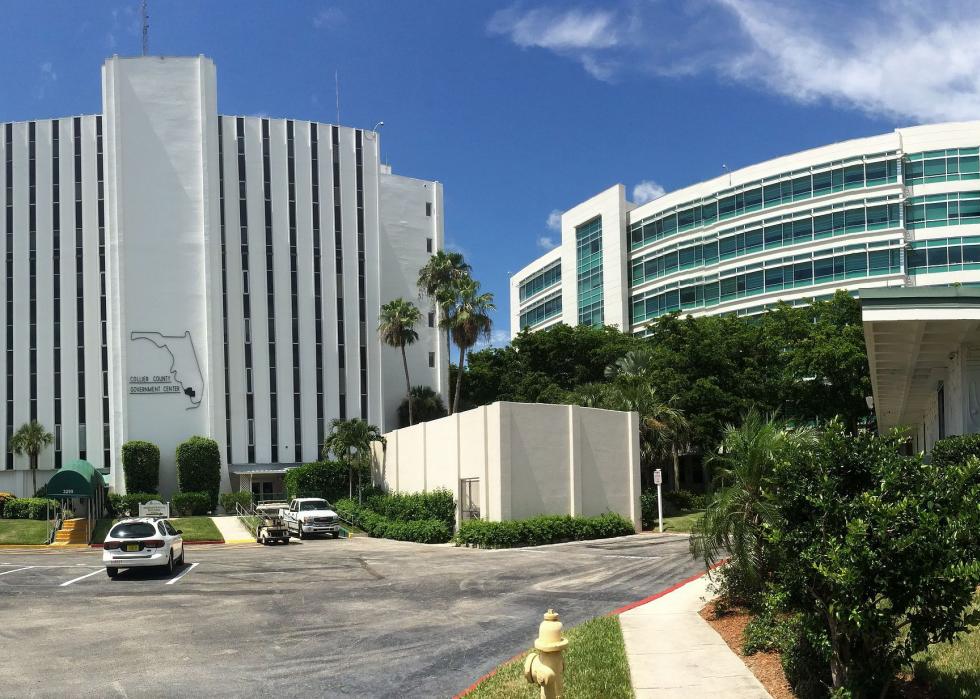
44 / 50Swarm // Wikimedia Commons
#7. Collier County
– Population that is fully vaccinated: 70.9% (273,038 fully vaccinated)
— 4.9% higher vaccination rate than Florida
– Cumulative deaths per 100k: 263 (1,012 total deaths)
— 25.1% less deaths per 100k residents than Florida
– Cumulative cases per 100k: 23,662 (91,076 total cases)
— 20.7% less cases per 100k residents than Florida

45 / 50Canva
#6. St. Johns County
– Population that is fully vaccinated: 71.0% (187,827 fully vaccinated)
— 5.0% higher vaccination rate than Florida
– Cumulative deaths per 100k: 216 (573 total deaths)
— 38.5% less deaths per 100k residents than Florida
– Cumulative cases per 100k: 25,316 (67,004 total cases)
— 15.1% less cases per 100k residents than Florida
46 / 50Canva
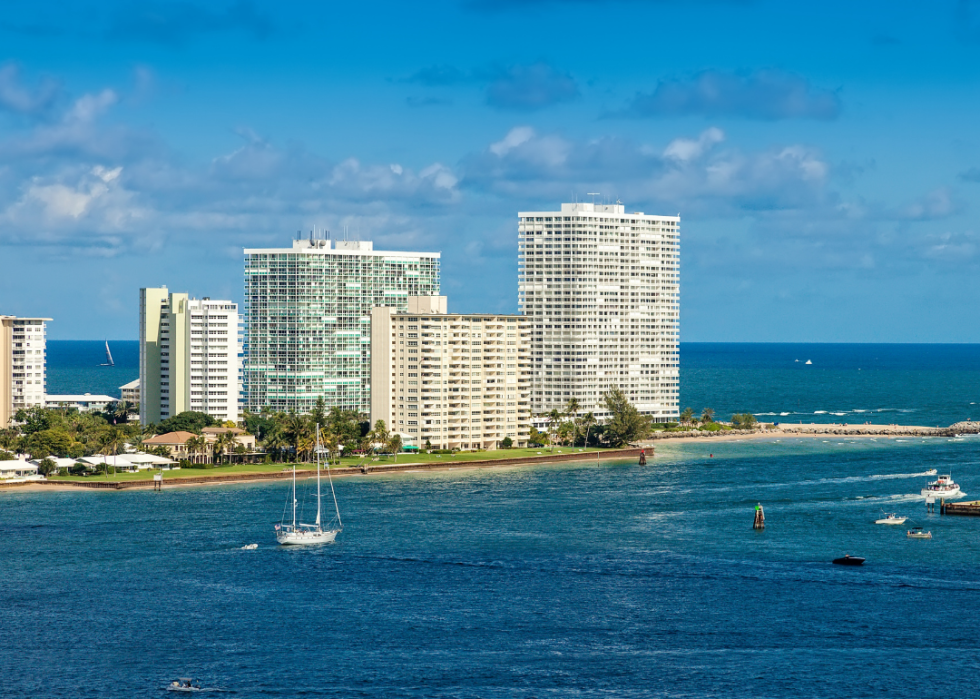
#5. Broward County
– Population that is fully vaccinated: 72.0% (1,406,940 fully vaccinated)
— 6.5% higher vaccination rate than Florida
– Cumulative deaths per 100k: 304 (5,929 total deaths)
— 13.4% less deaths per 100k residents than Florida
– Cumulative cases per 100k: 33,973 (663,419 total cases)
— 13.9% more cases per 100k residents than Florida

47 / 50Ebyabe // Wikimedia Commons
#4. Osceola County
– Population that is fully vaccinated: 73.8% (277,292 fully vaccinated)
— 9.2% higher vaccination rate than Florida
– Cumulative deaths per 100k: 308 (1,158 total deaths)
— 12.3% less deaths per 100k residents than Florida
– Cumulative cases per 100k: 32,832 (123,367 total cases)
— 10.0% more cases per 100k residents than Florida
48 / 50Canva
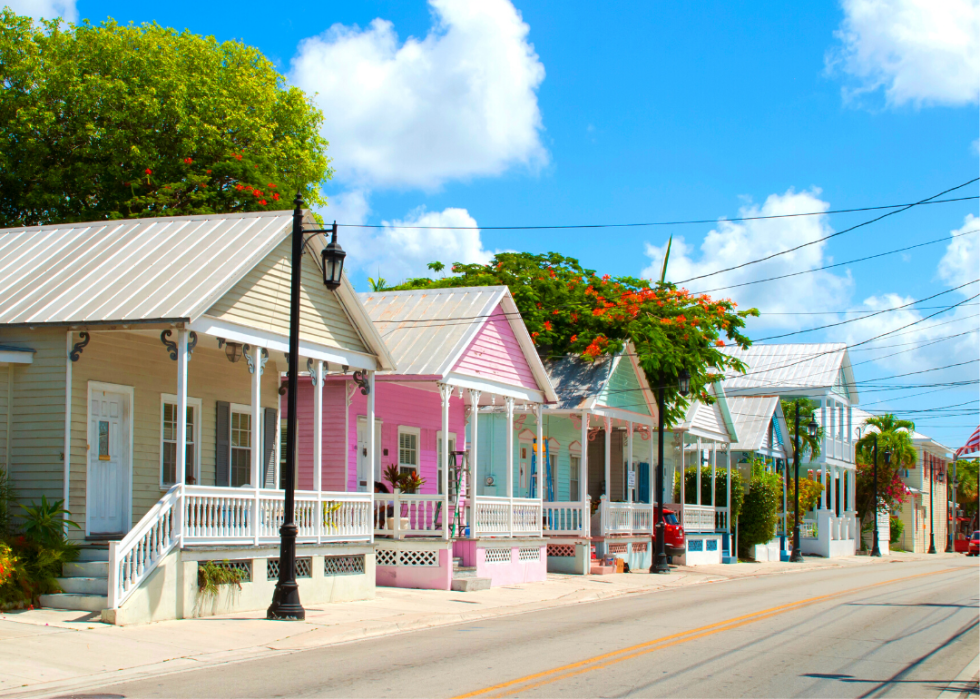
#3. Monroe County
– Population that is fully vaccinated: 79.2% (58,789 fully vaccinated)
— 17.2% higher vaccination rate than Florida
– Cumulative deaths per 100k: 162 (120 total deaths)
— 53.8% less deaths per 100k residents than Florida
– Cumulative cases per 100k: 26,735 (19,845 total cases)
— 10.4% less cases per 100k residents than Florida

49 / 50Ebyabe // Wikimedia Commons
#2. Sumter County
– Population that is fully vaccinated: 81.0% (107,287 fully vaccinated)
— 19.8% higher vaccination rate than Florida
– Cumulative deaths per 100k: 444 (588 total deaths)
— 26.5% more deaths per 100k residents than Florida
– Cumulative cases per 100k: 18,148 (24,031 total cases)
— 39.2% less cases per 100k residents than Florida

50 / 50Captain-tucker // Wikimedia Commons
#1. Miami-Dade County
– Population that is fully vaccinated: 85.9% (2,334,038 fully vaccinated)
— 27.1% higher vaccination rate than Florida
– Cumulative deaths per 100k: 406 (11,043 total deaths)
— 15.7% more deaths per 100k residents than Florida
– Cumulative cases per 100k: 48,242 (1,310,707 total cases)
— 61.7% more cases per 100k residents than Florida